Resources · Sound science
Your model doesn’t listen. It looks.
A model does not hear a recording. It reads a picture of it. The picture is called a spectrogram, and once you learn to read it the way a machine does, sound starts to look very different.
The misconception
You don’t feed a model audio
There is a common picture of how this works: you collect thousands of audio files, point a model at them, and it learns to recognise the sounds. Audio goes in, the answer comes out.
That is not what happens. Raw audio is a long list of numbers, the air pressure at the microphone sampled tens of thousands of times every second. A three second clip at 44,100 samples per second is more than 130,000 values in a single line. Hand a model that line and it finds almost no structure, the way you would struggle to recognise a face from a list of pixel values read out one at a time.
So before the model sees anything, the sound is transformed. The waveform becomes an image.
The transform
What a spectrogram is
A spectrogram is a picture of sound, with three things folded into two dimensions and a colour. Left to right is time. Bottom to top is frequency, low pitches near the floor, high pitches near the top. Brightness is energy: how much of that frequency is present at that moment.
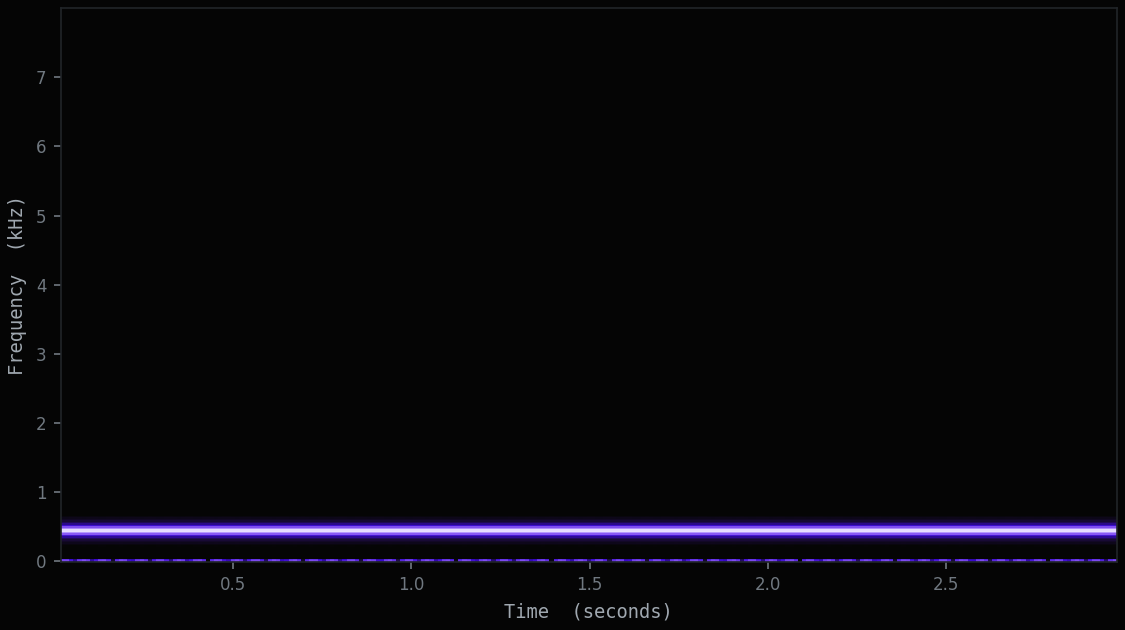
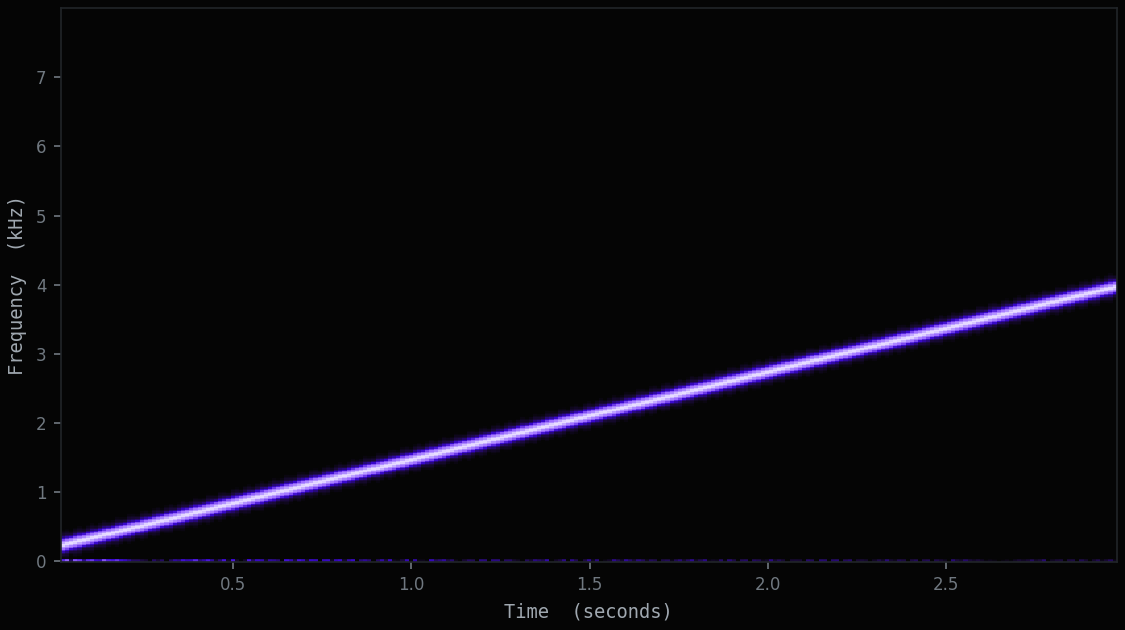
The transform behind the picture is the Short-Time Fourier Transform. The recording is cut into short overlapping windows, often around 25 milliseconds each, and every window is broken down into the frequencies it contains. Stack those slices side by side and structure that was invisible in the waveform becomes obvious: a rising whistle becomes a rising line, a rhythmic call becomes repeating columns, a flat hiss becomes a wide grey wash.
Why it works
A picture, not a waveform
There are two reasons the picture wins.
First, the patterns that matter become spatial. A species call, a spoken vowel, a failing bearing in a machine, each one has a shape on a spectrogram. A model can learn that shape the way an image model learns an edge or a texture, and decades of work on image recognition transfer almost directly.
Second, the picture is close to how hearing already works. The ear does not process raw pressure either: the cochlea separates sound into frequency bands before anything reaches the brain. A common variant, the mel spectrogram, spaces its bands the way human hearing does, fine resolution low down where we tell pitches apart well, coarser higher up. The model is handed a representation already shaped like perception.
In the field
What this means for sound in the wild
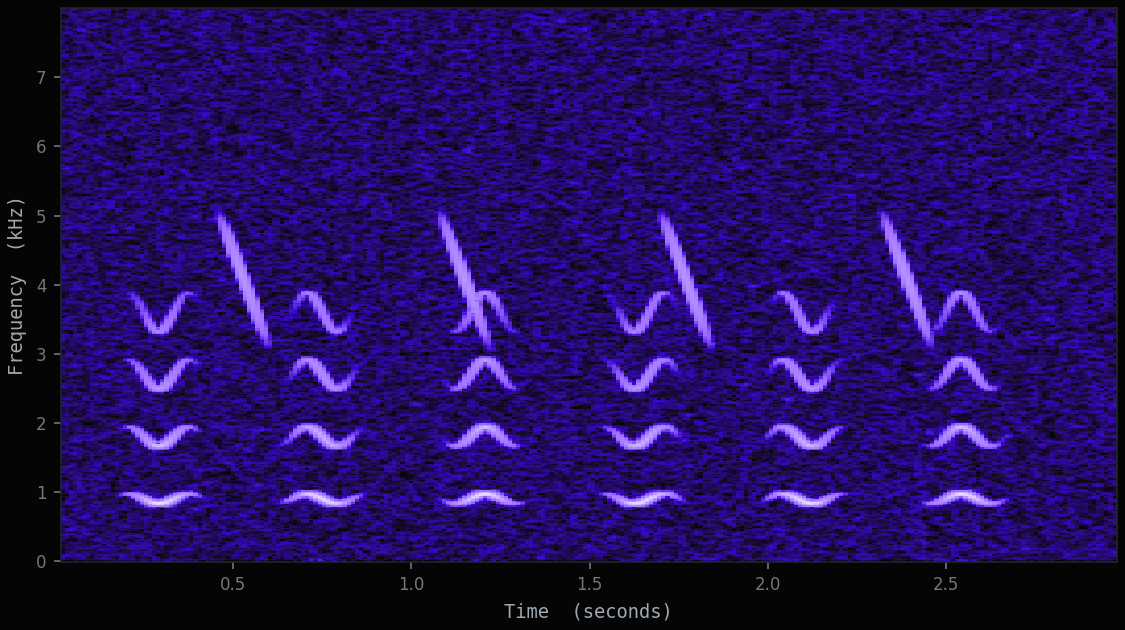
This is the working layer of bioacoustics. A field recorder in a wetland captures everything at once: wind, water, insects, distant traffic, and somewhere inside that mix, the call you are listening for. On a spectrogram that call keeps a recognisable shape even when it is faint, and a model trained on those shapes can flag it across thousands of hours that no person could review by ear.
The same property is what makes the picture fragile. A spectrogram has settings: how long each window is, how the frequency axis is spaced, how brightness is scaled. The wrong settings can bury the call you need, or smear two species into one. The picture is not neutral. Choosing how to draw it is part of the analysis, not a step before it.
Methodology and detection protocols documented per deployment. Available on consultation.
What the model actually saw
The next time you read that a model was trained on audio, picture what it really worked from: not the sound, but a careful drawing of the sound, made precise enough that a pattern could be found in it. Get the drawing right and the rest of the problem gets smaller.
Explore the divisions